Hypothesis Testing
Setting Up Hypothesis Tests - Part I
In this video, you learned a few rules for setting up null and alternative hypotheses:
-
The
is true before you collect any data.
-
The
-
The
are competing, non-overlapping hypotheses.
-
-
.
-
.
You saw that the statement, “Innocent until proven guilty” is one that suggests the following hypotheses are true:
-
-
We can relate this to the idea that “innocent” is true before we collect any data. Then the alternative must be a competing, non-overlapping hypothesis. Hence, the alternative hypothesis is that an individual is guilty.
Setting Up Hypothesis Tests - Part II
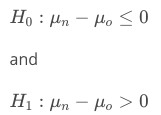
Because we wanted to test if a new page was better than an existing page, we set that up in the alternative. Two indicators are that the null should hold the equality, and the statement we would like to be true should be in the alternative. Therefore, it would look like this:
Here represents the population mean return from the new page. Similarly,
represents the population mean return from the old page.
Depending on your question of interest, you would change your null and alternative hypotheses to match.
Quiz- Set up Hypothesis:
Q1
| Statement | Hypothesis | Reasoning |
|---|---|---|
| The average height of all people in the world is different than 68 inches tall. | Alternative | Conclusion after collecting some data |
| The average height of all people in the world is less than 68 inches tall. | Alternative | Conclusion after collecting some data |
| The average height of all people in the world is less than or equal to 68 inches | Null | Has zero effect – “Equal to” |
| The impact of Drug A is on average the same as Drug B. | Null | Has zero effect – “same” |
| Drug A will on average have a larger impact than Drug B. | Alternative | Greater than – “large” |
Q2
Consider the following statement:
“Dyson air purifiers are the best.”
Which set of hypotheses could accurately test this statement?
Answer:
- Null: Dyson air purifiers are not the best.
- Alternative: Dyson air purifiers are the best.
Q3
Consider the following statement:
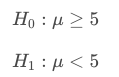
“The average height of a human is smaller than or equal to 70 inches.”
Which set of hypotheses below is correctly set up based on this assertion?
Answer:
- Null: The average height of a human is not greater than 70 inches.
- Alternative: The average height of a human is greater than 70 inches.
Types of Errors - Part I
QUIZ QUESTION
There are two types of errors that are possible in hypothesis testing: Type I Errors and Type II Errors. Type I Errors are considered the worst type of error. Just based on this information, can you guess which truth/decision combo is each type of error?
| TRUTH/DECISION | ERROR TYPE |
|---|---|
| Truth: Innocent, Decision: Guilty | Type 1 |
| Truth: Guilty, Decision: Innocent Type II Error | Type 2 |
| Truth: Innocent, Decision: Innocent | No error |
| Truth: Guilty, Decision: Guilty No Error | No error |
Types of Errors - Part II
Type I Errors
Type I errors have the following features:
-
You should set up your null and alternative hypotheses, so that the worse of your errors is the type I error.
-
They are denoted by the symbol α.
-
The definition of a type I error is: Deciding the alternative (
-
Type I errors are often called false positives.
-
Commonly these rates are 1-5%.
Type II Errors
-
They are denoted by the symbol β.
-
The definition of a type II error is: Deciding the null (
-
Type II errors are often called false negatives.
-
Frequently people will talk about the “power” of a statistical test as 1 - beta (or 1 minus the type two error rate). This is the ability of an individual to correctly choose the alternative hypothesis.
In the most extreme case, we can always choose one hypothesis (say always choosing the null) to ensure that a particular error never occurs (never a type I error assuming we always choose the null). However, more generally, there is a relationship where with a single set of data decreasing your chance of one type of error, increases the chance of the other error occurring.
Quiz: Types of Errors
n the following set of quizzes, you will be doing a recap and combination of the ideas that have been covered so far. Putting all of these pieces together is important for fully understanding hypothesis testing.
Consider we are interested in testing if the average revenue for a new marketing campaign is better than the previous marketing campaign.
We set up the null and alternative hypotheses in the following way:
where is the mean revenue of the old campaign, and
is the mean revenue of the new campaign.
Describe the Null hypothesis and Alternative Hypothesis
- The null is that the mean revenue of the new campaign is less than or equal to the mean revenue of the old campaign.
- The alternative is that the mean revenue of the new campaign is larger than the mean revenue of the old campaign.
Match the statement with the type of errors
| STATEMENT | ERROR |
|---|---|
| Deciding the new page is better, but really the old page is better. | Type I Error |
| Deciding the old page is better, but really the new page is better. | Type II Error |
Let’s try another situation. Consider you are testing a new cancer drug to see if it reduces tumor sizes in patients. Let be the average reduction in tumor size under the new drug. Let
be the average reduction in tumor size under the old drug.
We set up the null and alternative hypotheses in the following way:
What does the null hypothesis suggest?
- The old treatment will reduce tumors as well or better than new treatments (on average).
Another way to state the null hypothesis
- The null is that the old drug works as well or better than the new drug.
Match the Errors
| STATEMENT | ERROR |
|---|---|
| Based on the study results we decide the new drug is better, but really the old drug is better at reducing tumor sizes. | Type I Error |
| Based on the study results we decide the old drug is better, but really the new drug is better at reducing tumor sizes. | Type II Error |
Types of Errors - Part III
Type I Errors
Type I errors have the following features:
- You should set up your null and alternative hypotheses, so that the worst of your errors is the type I error.
- They are denoted by the symbol α.
- The definition of a type I error is: Deciding the alternative is true, when actually the null is true.
- Type I errors are often called false positives.
Type II Errors
- They are denoted by the symbol β.
- The definition of a type II error is: Deciding the null is true when actually the alternative is true.
- Type II errors are often called false negatives.
Parachute Example
This example let you see one of the most extreme cases of errors that might be committed in hypothesis testing. In a type I error an individual died. In a type II error, you lost 30 dollars.
In the hypothesis tests you build in the upcoming lessons, you will be able to choose a type I error threshold, and your hypothesis tests will be created to minimize the type II errors after ensuring the type I error rate is met.

Common Types of Hypothesis Tests
You are always performing hypothesis tests on population parameters, never on statistics. Statistics are values that you already have from the data, so it does not make sense to perform hypothesis tests on these values.
Common hypothesis tests include:
-
Testing a population mean (One sample t-test).
-
Testing the difference in means (Two sample t-test)
-
Testing the difference before and after some treatment on the same individual (Paired t-test)
-
Testing a population proportion (One sample z-test)
-
Testing the difference between population proportions (Two sample z-test)
You can use one of these sites to provide a t-table or z-table to support one of the above approaches:
There are literally hundreds of different hypothesis tests! However, instead of memorizing how to perform all of these tests, you can find the statistic(s) that best estimates the parameter(s) you want to estimate, you can bootstrap to simulate the sampling distribution. Then you can use your sampling distribution to assist in choosing the appropriate hypothesis.
How Do We Choose Between Hypotheses?
In order to put this idea to practice, let’s do an example. Follow along with the screencast below to see how this works. The video says the average height of coffee drinkers, but it is actually the average height of all individuals in the coffee dataset - some who drink coffee, but some who do not drink coffee.
After you work through the screencast, there is walk through of a second method we might use to choose between the competing hypotheses on the next concept. In this second screencast, you will use the common logic used in hypothesis testing. The video below uses the logic you gained in the earlier confidence interval lesson.
Notice the variable upper is the same as the variable high in the video.
Using your confidence interval, you can simply look at if the interval falls in the null hypothesis space or in the alternative hypothesis space to choose which hypothesis you believe to be true.
In the above case, our interval was entirely below 70, which would suggest the null (the population mean is less than 70) is actually true.
Simulating From the Null Hypothesis
In the previous lesson on confidence intervals, we saw how we could simulate a sampling distribution for a statistic by bootstrapping our sample data.
Alternatively, in hypothesis testing, we could simulate a sampling distribution from the null hypothesis using characteristics that would be true if our data were to have come from the null.
Hypothesis tests are about an entire population of interest. The equality portion belongs in the null, and the statement we are trying to prove generally appears in the alternative.
Simulating from the Null Solution
What is a p-value Anyway?
The definition of a p-value is the probability of observing your statistic (or one more extreme in favor of the alternative) if the null hypothesis is true.
In this video, you learned exactly how to calculate this value. The more extreme in favor of the alternative portion of this statement determines the shading associated with your p-value.
Therefore, you have the following cases:
If your parameter is greater than some value in the alternative hypothesis, your shading would look like this to obtain your p-value:

If your parameter is less than some value in the alternative hypothesis, your shading would look like this to obtain your p-value:

If your parameter is not equal to some value in the alternative hypothesis, your shading would look like this to obtain your p-value:

You could integrate the sampling distribution to obtain the area for each of these p-values. Alternatively, you will be simulating to obtain these proportions in the next concepts.
Calculating the p-value
Quiz 1 and Quiz 2 and Quiz 3
The quizzes on this page and the next page are to ensure you understand conceptually how the pieces fit together.
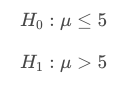
Use the following to answer the three quiz questions below. Imagine we have the following null and alternative hypotheses:
and you collect data that provide you with a sample mean of 10.
Select the statement that is true.
- We would expect the population mean to be greater than 5. Which of the following would be true regarding the p-value?
- We expect the p-value to be greater than 50%
Because 10 is to the right of the null mean of 5, and the alternative is less than, we shade to the left - this would shade more than half of the distribution. Imagine marking the center of the distribution at 5 and where 10 would be. Then you mark the 10, and shade according to the alternative (less than).
Base on your sample mean of 10, which hypothesis seems more likely to be true?
- The null is more likely to be true. Since the population is much greater than 5 (at 10), this suggests we should stick with the null. It is actually always the case that when your p-value is large you will end up staying with the null hypothesis as your choice.
 sample mean of 10
- We expect the population mean to be greater than 5.
- We expect the p=value to be less than 50%
Because 10 is to the right of the null mean of 5, and the alternative is greater than, we shade to the right - this would shade less than half of the distribution. Imagine marking the center of the distribution at 5 and where 10 would be. Then you mark the 10, and shade according to the alternative (greater than).
- The alternative is more likely to be true. Since the population mean is much greater than 5 (at 10), this suggests we should move to the alternative. It is actually always the case that when your p-value is small you will end up moving to the alternative hypothesis.
Connecting Errors and P-Values
The p-value is the probability of getting our statistic or a more extreme value if the null is true.
Therefore, small p-values suggest our null is not true. Rather, our statistic is likely to have come from a different distribution than the null.
When the p-value is large, we have evidence that our statistic was likely to come from the null hypothesis. Therefore, we do not have evidence to reject the null.
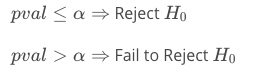
By comparing our p-value to our type I error threshold α, we can make our decision about which hypothesis we will choose.
Conclusions in Hypothesis Testing
The word accept is one that is avoided when making statements regarding the null and alternative. You are not stating that one of the hypotheses is true. Rather, you are making a decision based on the likelihood of your data coming from the null hypothesis with regard to your type I error threshold.
Therefore, the wording used in conclusions of hypothesis testing includes: We reject the null hypothesis or We fail to reject the null hypothesis. This lends itself to the idea that you start with the null hypothesis true by default, and “choosing” the null at the end of the test would have been the choice even if no data were collected.
Quiz: Connecting Errors and P-Values
| P-VALUE/ALPHA | CONCLUSION |
|---|---|
| p-value = 0.03, alpha = 0.05 | Reject the null |
| p-value = 0.20, alpha = 0.01 | Fail to reject the null |
| p-value = 0.10, alpha = 0.05 | Fail to reject the null |
Match the definition
| DEFINITION | DEFINITION TERM |
|---|---|
| The threshold for type I errors. | alpha |
| The worst type of error. | Type I error |
| Deciding the null is true, but really the alternative is true. | Type II error |
| Deciding the alternative is true but really the null is true. | Type I error |
| The choice made when the p-value is less than alpha | Reject the null hypothesis |
Quiz - Drawing Conclusions
Other Things to Consider - Impact of Large Sample Size
One of the most important aspects of interpreting any statistical results (and one that is frequently overlooked) is assuring that your sample is truly representative of your population of interest.
Particularly in the way that data is collected today in the age of computers, response bias is so important to keep in mind. In the 2016 U.S election, polls conducted by many news media suggested a staggering difference from the reality of poll results. You can read about how response bias played a role here.
Hypothesis Testing vs. Machine Learning
With large sample sizes, hypothesis testing leads to even the smallest of findings as statistically significant. However, these findings might not be practically significant at all.
For example, imagine you find that statistically more people prefer beverage 1 to beverage 2 in a study of more than one million people. Based on this you decide to open a shop to sell beverage 1. You then find out that beverage 1 is only more popular than beverage 2 by 0.0002% (but a statistically significant amount with your large sample size). Practically, maybe you should have opened a store that sold both.
Hypothesis testing takes an aggregate approach towards the conclusions made based on data, as these tests are aimed at understanding population parameters (which are aggregate population values).
Alternatively, machine learning techniques take an individual approach towards making conclusions, as they attempt to predict an outcome for each specific data point.
In the final lessons of this class, you will learn about two of the most fundamental machine learning approaches used in practice: linear and logistic regression.
Other Things to Consider - What If We Test More Than Once?
When performing more than one hypothesis test, your type I error compounds. In order to correct for this, a common technique is called the Bonferroni correction. This correction is very conservative, but says that your new type I error rate should be the error rate you actually want divided by the number of tests you are performing.
Therefore, if you would like to hold a type I error rate of 1% for each of 20 hypothesis tests, the Bonferroni corrected rate would be 0.01/20 = 0.0005. This would be the new rate you should use as your comparison to the p-value for each of the 20 tests to make your decision.
Other Techniques
Additional techniques to protect against compounding type I errors include:
Other Things to Consider - How Do CIs and HTs Compare?
A two-sided hypothesis test (that is a test involving a ≠ in the alternative) is the same in terms of the conclusions made as a confidence interval as long as:
For example, a 95% confidence interval will draw the same conclusions as a hypothesis test with a type I error rate of 0.05 in terms of which hypothesis to choose, because:
1 - 0.95 = 0.05
assuming that the alternative hypothesis is a two sided test.
Video on effect size here.